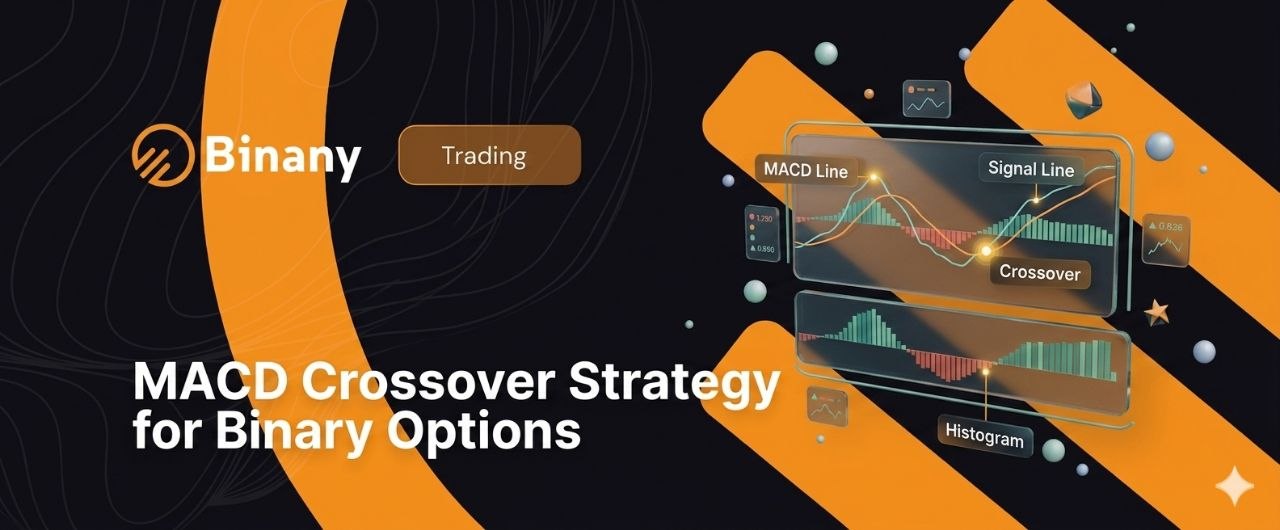
MACD Crossover Strategy for Binary Options: Full Guide for Binany
When it comes to EMA ribbon vs SMA ribbon binary options trading on Binany, the verdict is clear: EMA ribbon is the better choice for 1-minute and 5-minute charts
The MACD crossover strategy is one of the most complete tools available for binary options trading on Binany — because a single MACD panel gives you three separate signals at once. You get trend direction, momentum strength, and reversal warnings all in one place, without stacking multiple indicators on a crowded chart.
MACD (Moving Average Convergence Divergence) tracks the relationship between two exponential moving averages to reveal whether momentum is building, fading, or reversing. In binary options, this translates into three types of objective entry signals: signal line crossovers, zero line crossovers, and histogram turning points. Each one has different timing and different strength characteristics — and each requires specific confirmation before you place an option.
One thing has to be said clearly from the start: MACD is a lagging indicator. It confirms momentum shifts after they begin, not before. This means MACD will never put you in at the absolute top or bottom of a move. It is most reliable in trending markets and least reliable in sideways conditions — where it generates frequent false signals that produce consecutive losses if you trade them blindly.
This guide covers MACD components, all three crossover signal types, histogram reading, divergence, how to combine MACD with EMA and candlestick confirmation on Binany, and the four rules that filter out the majority of false signals.
What Is MACD and How Does It Work?
Before using MACD as part of your MACD strategy binary options setup, you need to understand what each component is measuring — because reading the indicator at a glance requires knowing what each visual element means.
The Three MACD Components
| Component | What it is | What it tells you |
| MACD Line | 12-period EMA minus 26-period EMA | Momentum direction: positive = bullish, negative = bearish |
| Signal Line | 9-period EMA of the MACD Line | Smoother trigger line — crossovers with MACD Line generate entry signals |
| Histogram | MACD Line minus Signal Line | Momentum strength: growing bars = accelerating momentum; shrinking bars = fading momentum |
| Zero Line | The horizontal baseline (value = 0) | Trend boundary: MACD above zero = bullish trend; below zero = bearish trend |
[Image: MACD indicator panel on Binany 5-minute chart showing MACD line, signal line, green histogram bars, and zero baseline]
The MACD Line signal line histogram explained in one sentence: the MACD Line measures raw momentum, the Signal Line smooths it, the histogram shows the gap between them, and the zero line separates bullish from bearish territory.
How to Read MACD at a Glance
MACD Line above zero and rising means short-term momentum is stronger than long-term — bullish conditions are in play. MACD Line below zero and falling means short-term momentum is weaker than long-term — bearish conditions dominate.
When the histogram is growing taller, the gap between the MACD Line and Signal Line is widening — momentum is accelerating. When the histogram starts shrinking toward zero, that gap is narrowing. A crossover may be approaching and it’s time to watch more closely.
Recommended Settings on Binany
The default MACD settings are 12, 26, 9 — the universal industry standard that works on any asset and timeframe. These MACD 12 26 9 settings binary options traders use are appropriate for the 5-minute chart on Binany without any adjustment.
To add MACD on Binany: open the Indicators panel, search for ‘MACD’, select the indicator, and set Fast EMA to 12, Slow EMA to 26, Signal period to 9. The MACD panel appears below the price chart automatically. Do not adjust the MACD settings binary options default until you have at least 50 tested trades at 12, 26, 9. Settings changes made without trade data behind them are guesswork.
Signal Type 1: MACD Line / Signal Line Crossover
The signal line crossover is the primary MACD signal — the one most traders learn first and use most frequently. The core of the MACD crossover strategy lives here.
What Is a Signal Line Crossover?
A signal line crossover occurs when the MACD Line crosses above or below the Signal Line. A MACD bullish crossover binary options signal happens when the MACD Line crosses above the Signal Line — short-term momentum is accelerating past the smoothed average, and a potential upward move is beginning. A MACD bearish crossover binary options signal happens when the MACD Line crosses below the Signal Line — short-term momentum is decelerating below the smoothed average, and a potential downward move is beginning.
The histogram makes crossovers immediately visible. When histogram bars cross from negative to positive (red to green), that is the signal line crossover — the two events are mathematically identical. You do not need to watch both; either visual tells you the same thing at the same moment.
[Image: MACD bullish crossover on EUR/USD Binany chart — MACD Line crossing above Signal Line with green histogram and Call entry marked]
Bullish Crossover: Call Entry
When the MACD signal line crossover binary options bullish signal fires, here is the entry sequence:
- Setup: MACD Line crosses above Signal Line. Histogram bars turn from negative (red) to positive (green).
- Location check: A bullish crossover near or below the zero line carries stronger signal quality. A crossover above zero is a continuation signal; below zero is a reversal signal.
- Confirmation candle: Wait for the next candle to close bullishly — a green body — after the crossover. Do not enter while the candle is still forming.
- Optional secondary confirmation: RSI above 50, or price above the 20 EMA.
- Entry: Bullish MACD crossover call option placed after the confirmation candle closes. Expiry: 3–5 candles on the entry timeframe (15–25 minutes on the 5-minute chart).
Bearish Crossover: Put Entry
The bearish MACD crossover put option sequence mirrors the bullish setup exactly:
- Setup: MACD Line crosses below Signal Line. Histogram bars turn from positive (green) to negative (red).
- Location check: Crossover near or above the zero line carries the strongest Put signal quality.
- Confirmation candle: Wait for the next candle to close bearishly — a red body — after the crossover.
- Entry: Put option placed after the confirmation candle closes. Expiry: 3–5 candles.
The confirmation candle rule is the most important practical rule in this entire strategy. Entering on the crossover candle while it is still open is the most common beginner mistake — a candle that looks bearish at 80% of its formation can still reverse and close green.
Signal Type 2: Zero Line Crossover (Center Line Crossover)
The zero line crossover is slower and less frequent than the signal line crossover — but what it signals is more significant.
What Is a Zero Line Crossover?
A MACD zero line crossover binary options signal occurs when the MACD Line crosses above or below the zero baseline. When the MACD Line crosses above zero, the 12-period EMA has moved above the 26-period EMA — the short-term trend has turned bullish at a structural level. When the MACD Line crosses below zero, the 12-period EMA is now below the 26-period EMA — the short-term trend has turned bearish.
Zero line crossovers are slower signals than signal line crossovers. They lag more but filter out more noise in strongly trending markets. Think of the signal line crossover as a sprint indicator and the zero line crossover as a direction compass. The MACD center line crossover binary options signal is most useful as a context filter, not a primary entry timing tool.
When to Use Zero Line Crossovers
Use the zero line to assess the quality of your signal line crossover entries, not to time entries on its own. A signal line bullish crossover that happens below the zero line is a reversal entry — stronger than one above. A signal line bearish crossover above the zero line is a reversal entry — stronger than one below zero.
When a MACD zero line crossover binary options signal occurs on its own, it requires both a candlestick confirmation and an RSI reading aligned with the direction before placing any option. The zero line alone is not enough.
Zero Line Crossover Signal Hierarchy
| Scenario | Signal quality | Action |
| Signal line crossover below zero line | Strongest Call | Enter Call with candlestick confirmation |
| MACD crosses zero line upward | Strong Call | Enter Call with RSI above 50 confirmation |
| Signal line crossover above zero line | Moderate Call | Enter Call only with strong EMA alignment |
| Signal line crossover above zero line (no EMA confirmation) | Weakest | Consider skipping — trend context is mixed |
Signal Type 3: Reading the Histogram for Momentum Clues
The MACD histogram strategy binary options traders use differently from crossovers: the histogram is the indicator’s early warning system. It shows momentum changes before the crossover lines confirm them.
How to Read the Histogram
Positive (green) bars mean the MACD Line is above the Signal Line — bullish momentum is present, and taller bars mean stronger momentum. Negative (red) bars mean the MACD Line is below the Signal Line — bearish momentum dominates, and deeper bars mean stronger selling pressure.
Growing bars signal that momentum is accelerating in the current direction. Shrinking bars signal something more important: the gap between MACD and Signal Line is narrowing. Momentum is fading before a crossover arrives. MACD histogram shrinking binary options traders who recognize this pattern get a head start on the next entry.
Reading MACD histogram binary options correctly means watching the direction of change — not just the color or size.
Histogram-Based Entry Anticipation
The first shrinking bar after a series of growing bars is the first sign that momentum is peaking. Watch for a crossover on the following candles. Three consecutive shrinking histogram bars in the same direction means a crossover is likely imminent — prepare for entry when the histogram bars change color.
When the histogram crosses zero, a signal line crossover has simultaneously occurred. These are the same event. You do not need separate analysis for both.
| Histogram reading | What it means | Action |
| Growing green bars | Bullish momentum accelerating | Stay in Call trades; don’t fade the trend |
| Shrinking green bars | Bullish momentum fading — watch for crossover | Prepare for possible Put — wait for red bars |
| Green to red (zero cross) | Bullish momentum ended — bearish crossover | Enter Put with confirmation |
| Growing red bars | Bearish momentum accelerating | Stay in Put trades; don’t fade |
| Shrinking red bars | Bearish momentum fading — watch for crossover | Prepare for possible Call — wait for green bars |
| Red to green (zero cross) | Bearish ended — bullish crossover | Enter Call with confirmation |
The MACD histogram momentum binary options signal is not an entry on its own — it is preparation. Confirmation still comes from the crossover and the candlestick close.
Signal Type 4: MACD Divergence
MACD divergence is the most advanced of the four signal types. It identifies reversals before crossovers confirm them, giving earlier entries at the cost of higher false signal risk and more subjectivity in reading the setup.
Bullish MACD Divergence (Call Setup)
Price makes a lower low — the downtrend appears to be continuing. At the same time, the MACD histogram or MACD Line makes a higher low — momentum is quietly recovering despite the lower price. MACD bullish divergence binary options traders read this as selling pressure losing conviction. A reversal toward the upside may be approaching before any crossover occurs.
Entry sequence: identify the divergence, confirm the MACD Line begins rising, wait for a bullish candlestick (hammer or bullish engulfing) at a key support level — then place a Call option. The support level is required. Divergence in empty chart space with no technical reference is significantly less reliable.
Bearish MACD Divergence (Put Setup)
Price makes a higher high — the uptrend appears to be continuing. The MACD histogram or MACD Line makes a lower high — buying momentum is weakening despite the new price extreme. MACD bearish divergence binary options signal means buyers are losing conviction. Entry: divergence confirmed, MACD Line begins falling, bearish candlestick at a known resistance level — Put option placed after the confirmation candle closes.
Divergence vs Crossover: Which to Prioritize?
| Aspect | MACD Divergence | Signal Line Crossover |
| Timing | Early — appears before the trend turns | Later — confirms after momentum has shifted |
| Reliability | Higher when at key support/resistance levels | More frequent; more false signals possible |
| Confirmation | Requires candlestick + level confluence | Requires candlestick + direction alignment |
| Best use | Catching reversal tops and bottoms | Entering trend pullbacks and momentum continuations |
The MACD divergence vs crossover binary options choice is not either-or. The strongest setups occur when divergence forms first and a crossover confirms it shortly after — a two-layer signal from the same indicator.
MACD Combination Strategies on Binany
MACD works best when combined with one or two confirming tools. The MACD EMA strategy binary options setup is the most effective for Binany’s 5-minute chart — here’s the full combination menu and the recommended primary setup.
| Combination | What each tool adds | Best use case |
| MACD + 20 EMA | EMA filters trend direction; MACD times the entry | Only take crossovers on the EMA trend side |
| MACD + Candlestick | Candlestick provides the exact entry trigger | Essential confirmation for every MACD crossover |
| MACD + RSI | RSI confirms momentum not yet exhausted | Strongest when RSI aligns with MACD direction |
| MACD + Bollinger Bands | Bollinger squeeze confirms volatility expansion | Breakout entries — MACD crossover inside squeeze |
| MACD + Support/Resistance | Key levels add weight to crossover signals | Signal line crossover at known level |
Primary Setup: MACD Crossover + 20 EMA + Candlestick (Recommended)
Add MACD (12, 26, 9) and a 20 EMA to the Binany chart on the 5-minute timeframe. This MACD moving average strategy binary options combination is the starting point for most traders because the EMA provides direction context that MACD alone cannot.
Bullish entry — Call: (1) 20 EMA sloping upward. (2) Price is above the 20 EMA — the trend is up. (3) MACD Line crosses above Signal Line — bullish crossover. (4) A bullish candlestick (hammer or engulfing) closes after the crossover. → Call option. Expiry: 15–25 minutes.
Bearish entry — Put: (1) 20 EMA sloping downward. (2) Price is below the 20 EMA — the trend is down. (3) MACD Line crosses below Signal Line — bearish crossover. (4) A bearish candlestick closes. → Put option. Expiry: 15–25 minutes.
The key rule: do not take a bullish MACD crossover when price is below a falling 20 EMA. That is a counter-trend entry. MACD double confirmation binary options setups require trend direction and crossover direction to agree — not just the crossover on its own.
Secondary Setup: MACD + RSI Filter
Add RSI (14) alongside MACD and use it purely as a filter. MACD RSI combination binary options setups work by eliminating entries where momentum may already be exhausted.
For Call entries: bullish MACD crossover + RSI between 40–65 (not overbought, with room to rise) = higher-probability entry. For Put entries: bearish MACD crossover + RSI between 35–60 (not oversold, with room to fall) = higher-probability entry.
Avoid MACD candlestick confirmation binary options Call entries when RSI is already above 70. Momentum at that level may be exhausted and another candle lower is possible before the move resumes. Avoid Put entries when RSI is below 30 for the same reason.
MACD Step-by-Step Entry Checklist on Binany
This is the MACD strategy step by step binary options process from chart setup to option placement on Binany.
Before Entering Any MACD Trade — Checklist
| Check | Call option requirement | Put option requirement |
| Trend (20 EMA) | Price above rising 20 EMA | Price below falling 20 EMA |
| MACD crossover type | MACD Line crossed above Signal Line | MACD Line crossed below Signal Line |
| Crossover location | Crossover at or below zero line (ideal) | Crossover at or above zero line (ideal) |
| Histogram | Bars turning green (positive) | Bars turning red (negative) |
| Candlestick confirmation | Bullish candle closes after crossover | Bearish candle closes after crossover |
| RSI (optional) | RSI between 40–65 | RSI between 35–60 |
| Expiry | 3–5 candles ahead (15–25 min on 5-min chart) | 3–5 candles ahead (15–25 min on 5-min chart) |
Step-by-Step Entry on Binany
- Open Binany chart. Select EUR/USD or Gold. Set timeframe to 5 minutes.
- Add MACD (12, 26, 9) and 20 EMA from the Indicators panel.
- Confirm the 20 EMA direction — is it rising (bullish bias) or falling (bearish bias)?
- Watch for the MACD Line to approach the Signal Line from below (bullish setup) or from above (bearish setup).
- When the crossover occurs, note the histogram bar color change — green bars for bullish, red bars for bearish.
- Wait for the next candle to close in the crossover direction. Do not enter while the crossover candle is still forming.
- Place Call (bullish) or Put (bearish) option. Set expiry to 15–25 minutes for the 5-minute chart.
- Log the trade in your journal: asset, MACD crossover type, zero line position, EMA alignment, expiry, outcome.
How to trade MACD crossover on Binany comes down to patience at step 6. The most common error is entering on the crossover candle itself — and that single habit change eliminates a significant portion of false entries.
MACD False Signals and How to Avoid Them
The MACD false signal binary options problem is real, predictable, and largely preventable. Understanding the three causes gives you the three solutions.
The Lagging Problem
MACD is a lagging indicator — it confirms momentum shifts after they have already begun. By the time a MACD crossover binary options signal appears, part of the move has already happened. This MACD lagging problem binary options traders experience is not a flaw you can fix with different settings — it is the nature of moving average-based indicators.
Accepting this means adjusting expectations. MACD is a confirmation tool, not a prediction tool. You will never catch the exact top or bottom with a crossover signal. What MACD gives you is high-confidence entries into moves that are already underway — and that is a reliable edge in binary options when applied with discipline.
Whipsaw Risk in Ranging Markets
In a sideways market with no clear trend, MACD crossovers can occur multiple times per hour. The MACD whipsaw binary options problem — bouncing back and forth across the Signal Line and zero line repeatedly — creates a series of crossovers that each look valid but immediately reverse. Every MACD false crossover binary options trade in this environment produces a loss, and they chain into consecutive losses quickly.
The solution: before taking any MACD signal, check the 20 EMA slope. A flat or horizontal EMA means a ranging market. Also check ADX — if ADX is below 20, no trend exists and MACD signals should be skipped entirely until a directional trend develops. How to filter MACD signals binary options traders ask about always starts with the trend confirmation step.
Four Rules to Reduce False MACD Signals
- Rule 1 — EMA filter: Only take bullish crossovers when price is above a rising 20 EMA. Only take bearish crossovers when price is below a falling 20 EMA. This single rule eliminates most counter-trend false entries.
- Rule 2 — Wait for candle close: Never enter on the crossover candle while it is still forming. Always wait for the next candle to close in the crossover direction. MACD signal confirmation binary options entries made after the close have a significantly better hit rate than those made mid-candle.
- Rule 3 — Zero line position: Bullish crossovers below zero are stronger. Bearish crossovers above zero are stronger. Crossovers near the zero line in either direction are the weakest — they require all other confirmations to be in place before considering entry.
- Rule 4 — Histogram confirmation: The histogram bars should be growing in the crossover direction after the signal — not immediately shrinking back. A crossover where histogram bars shrink within one or two candles is a weak signal and should often be skipped.
MACD Pros and Cons
| # | Pros | Cons |
| 1 | Three signal types in one indicator: crossover, zero line, divergence | Lagging — confirms after momentum starts, not before |
| 2 | Works on any Binany asset and timeframe | Produces frequent false signals in ranging markets |
| 3 | Histogram gives visual momentum strength at a glance | Whipsaw risk in sideways conditions — requires EMA filter |
| 4 | Divergence detects reversals before crossovers confirm them | Beginners often enter on crossover alone without confirmation |
| 5 | Combines powerfully with EMA, candlestick patterns, and RSI | Default 12, 26, 9 settings may lag on very short timeframes |
Conclusion
The MACD crossover strategy on Binany gives you three signal types from one indicator panel: signal line crossover (most frequent, primary entry tool), zero line crossover (trend filter and signal quality gauge), and divergence (earliest reversal warning, highest potential entry — most analysis required).
The signal hierarchy is consistent: bullish crossovers below the zero line produce the strongest Call signals; bearish crossovers above the zero line produce the strongest Put signals. Crossovers near the zero line in either direction require all confirmation layers before entry.
The entry rule never changes: wait for the confirmation candle to close after any crossover before placing the option. The primary MACD strategy Binany setup — MACD crossover + 20 EMA filter + candlestick confirmation — is the three-layer combination with the highest probability when all conditions align. Check the 20 EMA slope and ADX before every MACD crossover binary options entry. A ranging market invalidates all MACD signals regardless of how clean the crossover looks.
Open a free Binany demo account, add MACD (12, 26, 9) and 20 EMA to the EUR/USD 5-minute chart, and practise the entry checklist on at least 30 trades before going live. Watch specifically for bullish crossovers below the zero line with a rising 20 EMA — that is the highest-quality MACD crossover binary options signal available on this setup.
FAQ
Q1. What is the MACD crossover strategy for binary options?
The MACD crossover strategy uses the Moving Average Convergence Divergence indicator to identify momentum shifts and generate Call or Put option entries. Three main signals exist: the signal line crossover, which fires when the MACD Line crosses the Signal Line; the zero line crossover, which fires when the MACD Line crosses the zero baseline; and divergence, which appears when price and MACD move in opposite directions. Each signal type has different timing and reliability characteristics. MACD works best on trending assets with clear directional momentum, and always requires a confirmation candlestick close before you place any option. Never enter on the crossover candle itself.
Q2. How do I set up MACD on Binany?
Click the Indicators panel on the Binany chart, search for ‘MACD’, select the indicator, and set Fast EMA to 12, Slow EMA to 26, and Signal period to 9. These are the default industry-standard settings. The MACD panel appears below the price chart showing the MACD Line, Signal Line, and histogram bars in green and red. The recommended starting chart is the 5-minute candlestick on EUR/USD or Gold. Add a 20 EMA to the price chart alongside MACD — it acts as a trend direction filter that tells you which crossover direction to trade. Test everything on Binany demo before using a live account.
Q3. What is a bullish MACD crossover and when do I place a Call option?
A bullish MACD crossover occurs when the MACD Line crosses above the Signal Line, and the histogram bars turn from negative (red) to positive (green). Place a Call option after a bullish crossover when three conditions are met: the 20 EMA is sloping upward, the crossover happens at or below the zero line, and the next candle closes bullishly after the crossover. Expiry should be 15–25 minutes (3–5 candles) on the 5-minute chart. Do not enter while the crossover candle is still forming — only after the confirmation candle closes. RSI between 40–65 adds optional confirmation that momentum has room to develop.
Q4. What is the difference between signal line crossover and zero line crossover?
Signal line crossover fires when the MACD Line crosses the Signal Line — the most frequent and earliest crossover signal, generated when short-term momentum shifts direction. Zero line crossover fires when the MACD Line crosses the zero baseline — a slower, more significant signal indicating the overall trend direction has changed at the structural EMA level. Signal line crossovers below the zero line (bullish) or above it (bearish) are the strongest combined signals because they combine both signal types in one location. Use the zero line position to judge the quality of signal line crossover entries, not as a separate entry system.
Q5. How do I read the MACD histogram for binary options?
Growing green histogram bars mean bullish momentum is accelerating — existing Call positions are well-supported. Shrinking green bars mean bullish momentum is fading — watch for an upcoming bearish crossover and prepare to switch direction. When histogram bars cross from green to red, a bearish signal line crossover has just occurred — this is a Put entry signal once the confirmation candle closes. The reverse applies for bearish-to-bullish transitions. Shrinking bars in either direction are the earliest sign that a crossover is approaching, giving you preparation time before the signal fires. Watch bar direction change, not just bar color.
Q6. What is MACD divergence and how do I use it on Binany?
MACD divergence occurs when price and the MACD Line or histogram move in opposite directions. Bullish divergence: price makes a lower low but MACD makes a higher low — selling momentum is weakening and a reversal upward may follow. Bearish divergence: price makes a higher high but MACD makes a lower high — buying momentum is fading. Divergence gives an earlier entry signal than a standard crossover but requires more confirmation: wait for MACD to begin moving in the divergence direction AND a reversal candlestick (hammer or shooting star) to close at a key technical level before placing the option. Divergence without a supporting level is less reliable.
Q7. Why does MACD give false signals and how do I avoid them?
MACD produces false signals in sideways or ranging markets where price has no clear directional trend — the indicator whipsaws back and forth across the signal line repeatedly. Three fixes prevent most false entries. First, check the 20 EMA slope before every trade — only take MACD crossovers in the EMA trend direction. Second, verify ADX is above 20 to confirm a trend exists before entering any signal. Third, always wait for the confirmation candle to close after the crossover — never enter on the crossover candle itself. These three rules together eliminate the majority of MACD false crossover binary options losses that beginners experience.
Q8. What expiry time should I use with MACD crossover signals on Binany?
Match expiry to your chart timeframe. For 5-minute chart crossovers, use 15–25 minute expiry (3–5 candles ahead). For 1-minute chart crossovers, use 3–5 minutes. For divergence-based entries, use slightly longer expiry — 4–6 candles — because divergence reversals take more time to fully develop after the entry signal. Avoid very short expiry (1–2 minutes) for any MACD signal. MACD is a lagging indicator and needs time for the momentum shift to materialise in price movement. Expiry that is too short expires before the move develops, even when the signal was correct.

Financial writer and market analyst with a passion for simplifying complex trading concepts. He specializes in creating educational content that empowers readers to make informed investment decisions.