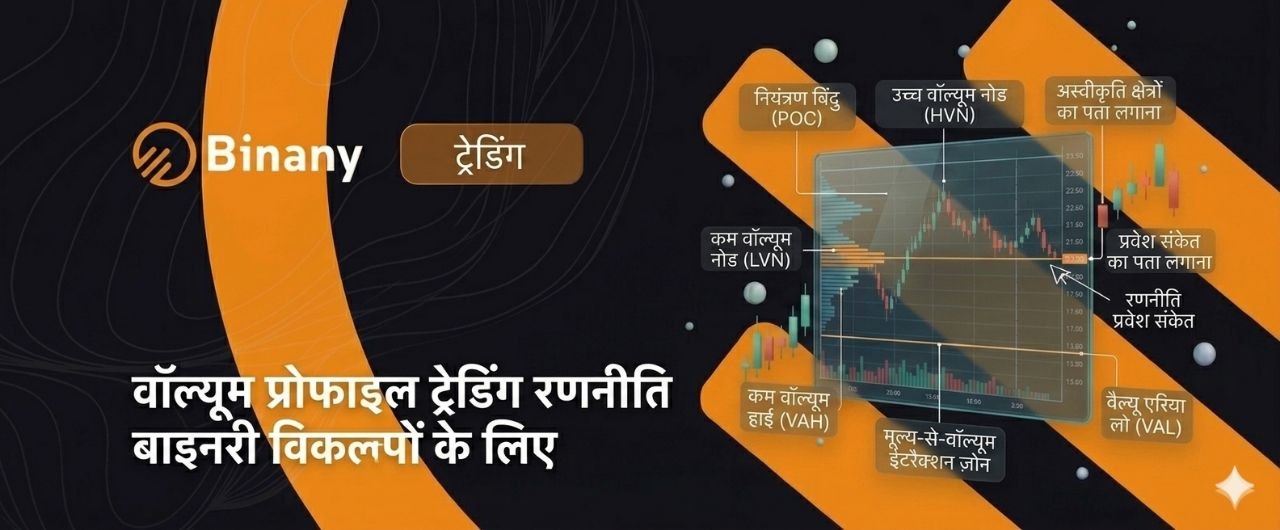
Volume Profile Trading Strategy for Binary Options: Guide for Binany Traders
Traditional support and resistance lines are drawn on price — they show where price has been
Traditional support and resistance lines are drawn on price — they show where price has been. Volume profile trading strategy goes further: it shows which of those price levels are backed by real institutional money and which are just lines on a chart. That distinction changes how reliable each level actually is.
Volume Profile is a charting tool that displays the total volume traded at each price level over a specified period — shown as horizontal bars directly on the price chart. Where the bars are thick, heavy trading occurred. Where they are thin or absent, almost no one traded. This volume binary options context tells you which levels matter to institutional participants, not just which levels look significant on a candlestick chart.
One important limitation applies to this tool and to Binany traders specifically: Volume Profile requires real exchange order book data to function accurately. S&P 500, NASDAQ, and Gold futures have this data. Forex pairs on Binany have only tick volume — less precise but still useful as a directional guide. OTC assets have no real volume data at all, so Volume Profile does not apply to them. This is explained fully in the Limitations section — the honest answer matters more here than a clean sales pitch.
This guide covers the four core components, how to read each signal type, the TradingView workflow for applying VP analysis to Binany, entry rules for each setup, and a complete entry cheat sheet.
What Is Volume Profile and How Does It Differ from Standard Volume?
Before applying the volume profile indicator binary options setup, you need to understand exactly what it measures — and why it answers a different question than the standard volume bars at the bottom of your chart.
Traditional Volume vs Volume Profile
| Feature | Traditional volume (volume bars) | Volume Profile (volume by price) |
| What it shows | Total volume traded in each time period (bar) | Total volume traded at each price level |
| Displayed as | Vertical bars at the bottom of the chart | Horizontal bars on the price chart |
| Question it answers | When was the most activity? | Where was the most activity? |
| Best use | Confirming momentum strength on a move | Identifying price levels with institutional interest |
| Available on Binany | Yes — directly on Binany charts | No — requires TradingView as external tool |
[Image: TradingView S&P 500 5-minute chart with VPVR Volume Profile — POC at tallest bar, VAH and VAL boundaries, HVN clusters and LVN gaps labelled]
Why Volume-at-Price Matters
A price level tested 20 times with no significant volume behind each test is weaker than a level tested twice with massive volume. Standard horizontal support/resistance lines cannot tell you this. Volume Profile makes it visible: thick horizontal bars mean many contracts changed hands at that price, which means strong institutional interest — and the level will likely act as significant support or resistance when price returns.
Thin or absent horizontal bars mean almost nobody traded at that price. Price passes through these zones quickly with minimal resistance. This is why traders who use Volume Profile treat its levels as more reliable than arbitrary horizontal lines — they are backed by actual transaction data, not visual pattern recognition alone.
The Four Core Volume Profile Components
Understanding each component before trading from it is not optional — you cannot reliably enter from levels you cannot correctly identify on a chart.
| Component | Abbreviation | What it represents | Signal type |
| Point of Control | POC | The single price level with the highest total volume | Magnet level — price gravitates toward and reverses from POC |
| Value Area | VA | The range containing 70% of total volume | Fair value zone — price frequently oscillates within VA |
| Value Area High | VAH | Upper boundary of the Value Area | Resistance — price above VAH may reject back inside |
| Value Area Low | VAL | Lower boundary of the Value Area | Support — price below VAL may bounce back inside |
| High Volume Node | HVN | Price levels with above-average volume clusters | Friction zones — price slows, consolidates, or reverses |
| Low Volume Node | LVN | Price levels with below-average volume | Speed zones — price passes through quickly, few participants |
Point of Control (POC) Explained
The Point of Control (POC) is the single busiest price level during the measured period — the exact price where the most contracts changed hands. It represents genuine market consensus: more participants agreed this was a fair price to trade at than anywhere else. This makes the POC a price magnet — price that moves away from the POC has a statistical tendency to return to it.
The POC’s most actionable form for binary options is the Naked POC: a Point of Control from a previous session that current price has not yet returned to visit. These unvisited levels act as strong magnets across subsequent sessions. The volume profile strategy Binany traders can apply most concretely is watching Naked POC levels for approach and rejection signals.
Value Area High (VAH) and Value Area Low (VAL)
The Value Area High (VAH) is the upper edge of the fair value zone. When price trades above VAH, it is in premium territory — potentially overextended above where most participants agreed value exists. Sellers may step in to push price back toward the POC.
The Value Area Low (VAL) is the lower edge. Price below VAL is in discount territory — potentially undervalued relative to the session’s consensus. Buyers tend to defend this level and push price back toward POC. The VAH-to-VAL range is the most contested zone in any session: price oscillates within it frequently during periods without a strong directional trend.
High Volume Nodes (HVN) and Low Volume Nodes (LVN)
HVN and LVN are the two structural features of the Volume Profile histogram that generate the clearest binary options trade setups. They behave in opposite ways.
| Feature | High Volume Node (HVN) | Low Volume Node (LVN) |
| Definition | Price level with above-average volume concentration | Price level with minimal volume — a gap in the histogram |
| What price does here | Slows, consolidates, or reverses | Moves quickly through — no resistance or support |
| Acts as | Strong support or resistance | Speed zone — fast price transit |
| Best strategy | Fade moves into HVN: enter reversal when price touches HVN | Enter breakouts: when price enters LVN, expect fast directional move |
| Binary options use | Wait for rejection candle at HVN → Call or Put | Enter option on LVN entry — directional move is fast |
Trading HVN Rejections
Setup: price approaches a High Volume Node (HVN) from below, where it is acting as resistance in a downtrend or ranging market. The HVN represents a zone where many previous participants traded — they are likely to sell again at or near that same price, creating resistance.
Wait for price to touch the HVN and show a rejection signal: a long wick, a bearish engulfing candle, or a shooting star. A bearish rejection candle that closes below the HVN boundary signals that sellers have stepped in exactly where Volume Profile predicted they would.
Entry: Bearish rejection candle closes below the HVN → Put option. Expiry: 3–5 candles. Confirm RSI is above 55 and turning down. Reverse the setup for an HVN acting as support: bullish rejection candle → Call option.
Trading LVN Breakouts
When price enters a Low Volume Node (LVN), the absence of participants means price can move quickly with minimal friction in either direction. This speed zone quality makes LVN breakouts one of the most time-sensitive but also one of the most reliable volume profile binary options setups.
Setup: price is in a clear directional trend and enters an LVN gap visible in the Volume Profile histogram. The gap confirms that almost no participants previously traded at these prices — there is nothing to slow the move down.
Entry: Strong directional candle enters the LVN zone → Call (upward) or Put (downward) option. Use slightly shorter expiry than usual — LVN moves resolve faster than HVN rejections. Rule: if price reaches the next HVN during the trade, the LVN transit is complete. Do not expect the move to continue through that HVN without a new breakout signal.
Naked POC Strategy: Trading the Price Magnet
The Naked POC is the most standalone-reliable signal in Volume Profile analysis. It does not require complicated confluence — the unvisited level itself carries significant gravitational pull.
What Is a Naked POC?
A Naked POC is the Point of Control from a previous session — yesterday’s session, last week’s session, or a session from several days ago — that current price has not returned to visit since it formed. The market literally has unfinished business at that level: the price where maximum volume traded was abandoned before it could fully resolve.
The analogy: imagine a busy market square that suddenly closes without warning. When it reopens, foot traffic returns because the square was important before. Price behaves similarly — markets tend to revisit and resolve high-activity levels that were left unexplored.
Naked POC Trade Setup
Identify a Naked POC from the previous session on TradingView using the Fixed Range Volume Profile tool, anchored over that session’s price range. Note the exact price level of the POC. Switch to the Binany chart for the same asset and draw a horizontal line at that level.
When price approaches the Naked POC: watch for a reversal candlestick signal. Price frequently reverses at POC after initially testing it, because participants who previously traded heavily at that level activate again when price returns.
If price instead pushes through the Naked POC with a strong candle and closes fully beyond it, the POC has become a support/resistance flip — trade the continuation in the breakout direction.
Entry: Reversal at POC → Call or Put based on the direction of the rejection. Expiry: 4–6 candles. POC levels need more time to develop their full effect than standard support/resistance bounces — shorter expiry cuts off the setup before it resolves.
VWAP: The Accessible Volume Profile Proxy for Forex
For Binany traders working with EUR/USD, GBP/USD, and other forex pairs — where full Volume Profile accuracy is limited — VWAP (Volume Weighted Average Price) is the most practical volume-based reference available.
Why VWAP Matters for Binany Forex Traders
VWAP calculates the average price weighted by the volume traded during the session. It represents the price that most participants effectively paid on average — the single most important fair-value reference for intraday trading. Price above VWAP means the asset is trading at a premium to fair value. Price below VWAP means it is trading at a discount.
| Feature | Full Volume Profile | VWAP |
| Volume source | Real exchange volume (ideal) | Tick volume (proxy for forex) |
| Shows | Full distribution at every price level | Single weighted average line |
| Best use | Identifying specific HVN/LVN/POC levels | Identifying general fair value and intraday bias |
| Available on Binany | No — TradingView only | Yes — add via Binany indicators panel |
| Best assets | S&P 500, NASDAQ, Gold futures | EUR/USD, GBP/USD, all forex pairs |
VWAP Entry Rule on Binany
[Image: Binany EUR/USD 5-minute chart with VWAP indicator and horizontal levels drawn from TradingView Volume Profile analysis — Call entry at VWAP with hammer candle]
Call entry: Price pulls back to VWAP from above + RSI between 35–50 (neutral to slightly oversold) + bullish candlestick closes at the VWAP line → Call option. Expiry: 3–5 candles.
Put entry: Price bounces up to VWAP from below + RSI between 50–65 (neutral to slightly overbought) + bearish candlestick closes at the VWAP line → Put option. Expiry: 3–5 candles.
VWAP as a VWAP strategy binary options tool works on Binany’s 5-minute and 15-minute charts directly without needing TradingView — it is the one volume-weighted reference traders can add within the Binany indicator panel itself.
Critical Limitation: Volume Profile and Binany Assets
This section is not optional reading. Applying Volume Profile to the wrong assets produces false confidence in meaningless levels — and that leads to consistent losses that are misattributed to setup failure rather than tool misuse.
Where Volume Profile Works on Binany Assets
| Asset type | Volume Profile applicability | Recommended approach |
| S&P 500, NASDAQ, DAX indices | Excellent — real exchange volume available | Use TradingView VPVR fully; high accuracy |
| Gold (XAU/USD) futures | Good — CME futures volume available | Use with TradingView — acceptable accuracy |
| EUR/USD, GBP/USD Forex | Limited — tick volume only, not real market volume | Use as approximate guide; combine with price action |
| OTC assets on Binany | Not applicable — algorithm-generated prices, no real volume | Do not use VP on OTC; use EMA ribbon or RSI instead |
S&P 500 and NASDAQ are the best assets for Volume Profile analysis on Binany. These exchange-traded instruments have real, verifiable order book data — POC, VAH, VAL, HVN, and LVN levels derived from this data carry genuine institutional weight.
Gold (XAU/USD) is a solid second choice. CME Gold futures volume is available on TradingView and transfers reliably to the Binany Gold chart.
Where Volume Profile Works Approximately
Forex pairs — EUR/USD, GBP/USD, and others — have no centralized exchange. TradingView’s Volume Profile on forex uses tick volume, which counts the number of price changes rather than actual contracts traded. The resulting levels are directionally useful but not as precise as exchange-based data.
Use forex VP levels as probability zones rather than exact prices. Widen your entry zone by a few pips in either direction, and always require a strong candlestick confirmation before placing the option.
Where Volume Profile Does Not Work
OTC assets on Binany use algorithm-generated price feeds with no real market participants behind them. There is no order book, no institutional activity, and no real volume to measure. Volume Profile on OTC is not an approximation — it is meaningless. For OTC assets, use EMA ribbon, RSI, or candlestick pattern analysis instead.
Rule: before applying the volume profile indicator binary options analysis to any Binany asset, confirm whether real exchange volume exists for that asset. If it does not — use a different analytical method.
Workflow: Using TradingView Volume Profile with Binany
Binany does not have a built-in Volume Profile tool. The practical solution is to use TradingView for analysis and Binany for execution — a dual-screen workflow that takes under 5 minutes to set up.
Setting Up VPVR on TradingView
- Open TradingView (tradingview.com). Search for the asset you are trading on Binany — for example, ‘SPX’ for S&P 500 or ‘XAUUSD’ for Gold.
- Set the chart to the same timeframe you are using on Binany — 5-minute or 15-minute.
- Click the Indicators button. Search for Volume Profile Visible Range (VPVR) and add it. This displays the Volume Profile for the price range currently visible on your screen.
- Horizontal histogram bars appear on the right side of the chart. Identify: the POC (longest single bar), the VAH and VAL (70% volume boundaries), thick clusters (HVN), and visible gaps (LVN).
- Mark the key levels on the TradingView chart: POC, VAH, VAL, significant HVNs, and any Naked POC from the previous session.
- Switch to your Binany chart for the same asset. Draw horizontal lines at those exact price levels.
- Trade from those levels on Binany using candlestick confirmation when price reaches each marked zone. Do not enter on price proximity alone — wait for the candle to close.
This TradingView volume profile Binany workflow separates the analysis platform from the execution platform — and it is how volume profile strategy Binany traders who operate at an advanced level actually use this tool.
Volume Profile Entry Cheat Sheet
This is the primary practical reference table. Use it as a quick-access guide for each setup type.
| Setup | Level | Entry trigger | Option & expiry |
| POC rejection (bearish) | Price touches POC from below (POC = resistance) | Shooting star or bearish engulfing closes below POC | Put — 4–6 candles |
| POC rejection (bullish) | Price touches POC from above (POC = support) | Hammer or bullish engulfing closes above POC | Call — 4–6 candles |
| Naked POC magnet | Price moving toward unvisited prior-session POC | Strong directional candle through LVN toward Naked POC | Call or Put in Naked POC direction — 4–6 candles |
| VAH rejection | Price tests VAH (premium territory) | Bearish candle rejects VAH — RSI above 60 | Put — 3–5 candles |
| VAL bounce | Price tests VAL (discount territory) | Bullish candle bounces VAL — RSI below 40 | Call — 3–5 candles |
| HVN rejection | Price approaches HVN from opposite side | Reversal candle at HVN — wick rejection confirmed | Call or Put against HVN — 3–5 candles |
| LVN breakout | Price enters a low-volume gap zone | Strong momentum candle with no pullback inside LVN | Call or Put in breakout direction — 2–3 candles (fast move) |
| VWAP pullback (forex) | Price pulls back to VWAP from above | Hammer + RSI 35–50 at VWAP line | Call — 3–4 candles |
Every entry in this table requires a confirmed candlestick close before placing the option. Volume Profile identifies the zone — the candle identifies the moment. Never enter on price proximity alone.
Conclusion
Volume Profile reveals the price levels that actually mattered — the ones where institutional participants concentrated their activity. The POC acts as a magnet, VAH and VAL set the boundaries of fair value, HVNs create friction zones, and LVNs create speed zones where price transits rapidly. Together they give binary options traders a more precise and data-backed framework than horizontal support/resistance lines drawn by eye.
The asset hierarchy is concrete: full accuracy on S&P 500 and NASDAQ → good on Gold → approximate on forex pairs → not applicable on OTC. Before applying volume profile binary options analysis to any asset, confirm that real exchange volume exists. If it does not, use VWAP or indicator-based methods instead.
The workflow is always the same: TradingView VPVR for analysis, level marking on Binany, candlestick confirmation before entry. The Naked POC — an unvisited prior-session Point of Control — is the most reliable and immediately actionable signal in the entire volume profile trading strategy toolkit.
Open TradingView, add VPVR to the S&P 500 5-minute chart, and mark today’s POC and Value Area boundaries. Then draw those same levels on your Binany demo chart and wait for the next rejection candle before placing a trade. The levels are there every session — the discipline is in waiting for the confirmation.
FAQ
Q1. What is Volume Profile and how does it work in trading?
Volume Profile is a charting tool that shows the total volume traded at each price level over a specified period — displayed as a horizontal histogram on the price chart. Unlike traditional volume bars that show how much was traded per time period, Volume Profile shows where the most trading activity occurred. The key components are: the Point of Control (POC — the busiest price level), the Value Area (the range containing 70% of total volume), High Volume Nodes (HVN — heavy-activity zones), and Low Volume Nodes (LVN — thin-activity speed zones). These levels reveal where institutional participants concentrated activity during the measured period.
Q2. What is the Point of Control (POC) in Volume Profile?
The Point of Control is the single price level that had the highest total trading volume during the measured period — the price where the most contracts changed hands. It represents market consensus: more participants agreed this was a fair price than anywhere else in the session. Price tends to gravitate back toward the POC after moving away from it. A Naked POC is a POC from a previous session that current price has not yet returned to visit. These unvisited levels act as strong magnets and frequently attract price back over the following sessions — making them the most actionable standalone Volume Profile signal for binary options.
Q3. What is the Value Area in Volume Profile trading?
The Value Area is the range of price levels containing 70% of total volume from the measured period. It represents the zone where market participants considered the price to be fair. The upper boundary — the Value Area High (VAH) — marks where price enters premium territory when exceeded. The lower boundary — the Value Area Low (VAL) — marks the discount zone when breached. VAH typically acts as soft resistance and VAL as soft support, both backed by actual transaction data rather than visual pattern recognition. Price inside the Value Area oscillates within the fair zone and tends to return to the POC.
Q4. What is the difference between HVN and LVN in Volume Profile?
High Volume Nodes (HVN) are price levels with above-average volume concentration — they appear as thick horizontal bars in the Volume Profile histogram. Price tends to slow down, consolidate, or reverse at HVNs because many participants previously traded there and will likely do so again at similar prices. Low Volume Nodes (LVN) are the opposite: thin or absent bars showing minimal prior trading activity. Price passes through LVNs quickly because almost no participants are defending those levels. The trading approach is different for each: fade rejections at HVNs for reversal entries, and enter breakout or continuation trades when price moves into LVN gaps.
Q5. Does Volume Profile work for forex and binary options on Binany?
Volume Profile requires real exchange order book data, which limits its accuracy on forex pairs. EUR/USD, GBP/USD, and other forex pairs traded on Binany do not have centralized exchange volume — only tick volume is available, which counts price changes rather than actual contracts. This makes Volume Profile less precise on forex than on exchange-traded assets. For Binany traders, VP works most accurately on S&P 500 and NASDAQ indices (real exchange volume), acceptably on Gold using CME futures data, approximately on forex pairs with tick volume, and not at all on OTC assets. Always check volume source availability before applying the tool.
Q6. How do I use Volume Profile with Binany if it is not available on the platform?
The practical workflow uses TradingView for Volume Profile analysis and Binany for trade execution. On TradingView, add the Visible Range Volume Profile (VPVR) indicator to the S&P 500, NASDAQ, or Gold chart at the same timeframe you are using on Binany. Identify the POC, VAH, VAL, significant HVN clusters, and any Naked POC from the previous session. Draw horizontal lines at those levels on TradingView, then open the same asset on Binany and draw the corresponding lines at the same prices. Wait for candlestick confirmation when price reaches each level before placing your Call or Put option. Never enter on proximity alone.
Q7. What is VWAP and how does it relate to Volume Profile for Binany traders?
VWAP (Volume Weighted Average Price) is a single-line approximation of the fair value concept that full Volume Profile provides in detail. It calculates the average price weighted by volume traded during the session. Unlike full Volume Profile, VWAP is available directly in Binany’s indicator panel — making it the most accessible volume-weighted reference for traders who work with forex pairs where real VP data is unavailable. Price above VWAP indicates premium territory; price below indicates discount. Pullbacks to the VWAP line with confirming candlestick signals — hammer for Call entries, shooting star for Put entries — are reliable intraday setups directly on Binany.
Q8. Which assets on Binany are best for Volume Profile trading?
S&P 500 and NASDAQ are the best assets for Volume Profile analysis in the Binany context because they have real exchange volume available on TradingView, making POC, VAH, VAL, HVN, and LVN levels highly accurate. Gold (XAU/USD) is the second-best choice using CME futures data on TradingView — acceptable accuracy for POC and Value Area identification. EUR/USD and other major forex pairs can use TradingView VP with tick volume as a directional approximation. OTC assets on Binany should not use Volume Profile at all — use RSI, EMA ribbon, or candlestick pattern analysis for OTC assets instead, as no real volume data underlies their price feeds.

Financial writer and market analyst with a passion for simplifying complex trading concepts. He specializes in creating educational content that empowers readers to make informed investment decisions.