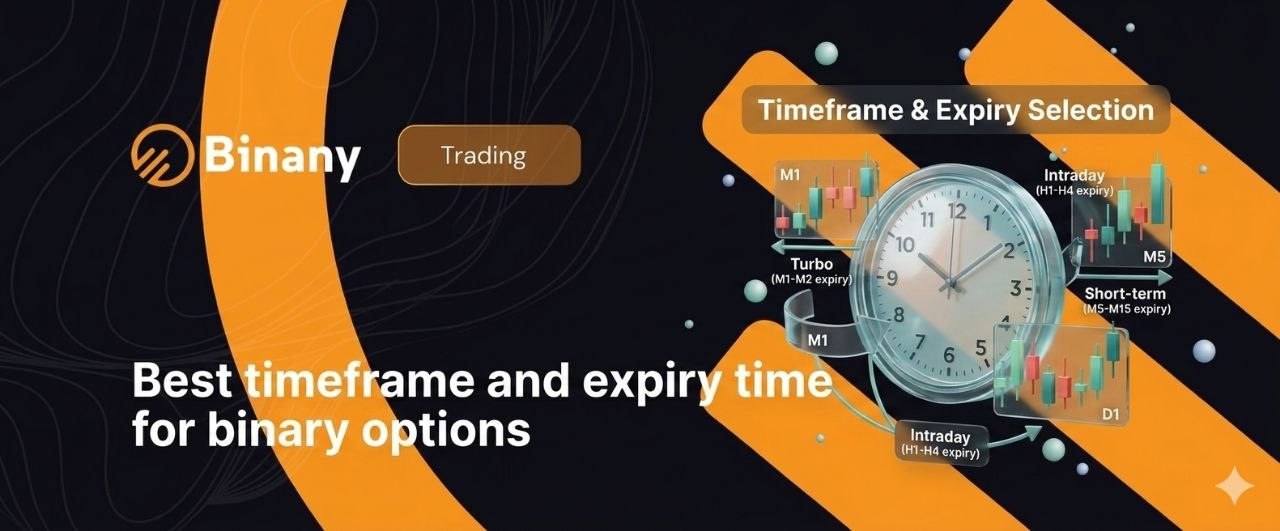
Best Timeframe and Expiry Time for Binary Options on Binany: A Complete Guide
Most beginners make two critical mistakes before a single trade is even placed: they choose a timeframe based on how fast the action feels, and they set their binary options expiry time randomly. The result is that even a correct directional analysis — the right asset, the right signal — produces a losing trade because the timeframe was too noisy or the expiry was too short
Best Timeframe and Expiry Time for Binary Options on Binany: A Complete Guide
Most beginners make two critical mistakes before a single trade is even placed: they choose a timeframe based on how fast the action feels, and they set their binary options expiry time randomly. The result is that even a correct directional analysis — the right asset, the right signal — produces a losing trade because the timeframe was too noisy or the expiry was too short. This guide gives you a clear, practical framework for matching your timeframe and expiry time to your strategy on Binany, so that good analysis actually translates into results.
What Is a Timeframe and Why Does It Matter in Binary Options?
A timeframe is the time period that each candlestick on your chart represents. On an M1 chart, every candle covers one minute of price movement. On an M15 chart, every candle covers fifteen minutes. On H1, each candle represents a full hour. The timeframe you choose determines what level of detail you see — and, critically, how much of what you see is meaningful signal versus random noise.
Higher timeframes filter out the erratic short-term price fluctuations that dominate lower timeframes. On M15, a pin bar at a support zone reflects a genuine battle between buyers and sellers that played out over 15 minutes — a meaningful rejection. On M1, what looks like a pin bar may simply be a 60-second fluctuation driven by a single large order, a spread adjustment, or algorithmic activity that has nothing to do with supply and demand.
This signal quality difference has a direct impact on your binary options win rate. A pin bar on M15 at a key level might win 60–65% of the time when entry conditions are right. The same-looking candle on M1 at the same level might win 45–50% — below the profitability threshold even for strategies that technically work. Choosing the right binary options timeframe strategy is not optional. It’s foundational.
Why M1 Is the Most Dangerous Timeframe for Binary Options
M1 attracts beginners for an obvious reason: it’s exciting. A new candle appears every minute, setups form and resolve quickly, and the pace feels like active trading. The problem is that almost everything happening on an M1 chart is noise — price movement driven by individual large orders, automated algorithms, bid-ask spread adjustments, and random fluctuations that have no relationship to the underlying supply and demand structure.
When you see a bullish pin bar form on an M1 chart, you’re looking at 60 seconds of price action. That pin bar might mean sellers pushed price down briefly and buyers recovered it — a genuine rejection. Or it might mean one algorithmic order moved the spread for a few seconds and price snapped back. There’s no reliable way to tell from a 60-second candle, which is why M1 pin bars fail at a dramatically higher rate than M15 pin bars — regardless of where they appear on the chart.
There’s also a psychological trap embedded in M1 trading. The fast pace creates the illusion of productivity. You take 30 trades in a session — many more than on M15 — and the activity feels like skill. But without signal quality, volume of trades works against you. Thirty low-probability trades multiplied by a sub-50% win rate produces losses faster than five high-probability setups with a 60% win rate.
Avoid M1 entirely. Even experienced traders with fast strategies use M5 at minimum. For anyone building a reliable binary options timeframe strategy on Binany, M1 is not a starting point — it’s a dead end.
The Best Timeframes for Binary Options Trading on Binany
Here’s how each timeframe tier performs in practice, and which type of trader each suits:
| Timeframe | Candle Period | Signal Quality | Best For | Recommended Expiry |
| M1 | 1 minute | Very Low — noise-dominated | Not recommended for binary options | — |
| M5 | 5 minutes | Low-Moderate | Experienced traders with fast setups | 15–25 min (3–5 candles) |
| M15 ★ | 15 minutes | Good — recommended | Beginners and intermediate traders | 45–60 min (3–4 candles) |
| M30 | 30 minutes | High — fewer, stronger signals | Traders who prefer quality over quantity | 60–90 min (2–3 candles) |
| H1 | 1 hour | Very High — trend analysis | Identifying trend direction and key levels only | Not for entry timing |
| H4 / Daily | 4 hours / 1 day | Highest — major structure | Drawing major support/resistance zones | Not for entry timing |
M15 is the recommended starting point for the majority of Binany traders. The 15-minute candle contains enough data to produce meaningful patterns — pin bars, engulfing candles, and Bollinger Band touches that reflect genuine price dynamics. It generates enough setups per session (typically 3–8 on a focused asset) to keep a trading session productive without overloading you with marginal signals.
M30 is ideal once you’ve built chart-reading experience on M15. The signals are less frequent but more reliable — each candle represents 30 minutes of sustained price commitment. Support and resistance bounces on M30 at levels confirmed on H1 are among the strongest setups available for binary options on Binany.
H1 and above are your map, not your entry point. Use them to identify the prevailing trend direction and mark the most significant support and resistance zones before each session. Then drop to M15 or M30 to find your entry. This is the top-down approach — and it’s covered in more detail in the multiple timeframe analysis section below.
How to Choose the Right Expiry Time for Your Trade
The fundamental rule for binary options expiry time is this: your expiry should cover 3–4 candles on your chosen chart timeframe. That window gives the trade enough time for your analysis to play out, while limiting how long you’re exposed to unrelated market forces that could reverse the move.
| Chart TF | Candle Duration | Recommended Expiry | Formula | Example Asset |
| M5 | 5 min/candle | 15–25 minutes | 3–5 candles × 5 min | Fast-moving pairs (GBP/JPY) |
| M15 ★ | 15 min/candle | 45–60 minutes | 3–4 candles × 15 min | EUR/USD, GBP/USD |
| M30 | 30 min/candle | 60–90 minutes | 2–3 candles × 30 min | Gold, EUR/USD |
| H1 | 60 min/candle | Not for entries | — | Trend analysis only |
On M15 with a 45-minute expiry: you’re giving the trade 3 full candles to develop. If a bullish pin bar forms at support, you expect price to move upward within that window. If it doesn’t, the signal was wrong — and 45 minutes is a reasonable window to confirm that without waiting so long that a new market session or news event complicates the outcome.
On M30 with a 60–90 minute expiry: you’re working with 2–3 candles. The signals are stronger because they’ve taken longer to form, and the expiry window reflects that. A support bounce on M30 needs a full hour at minimum to show the recovery price action that validates the setup.
Expiry that is too short — say, a 5-minute expiry on an M15 chart — gives price no room to move in your direction. Even if your analysis is completely correct, random noise in the first 5 minutes might push price the wrong way and close the trade as a loss before the real move develops. This is one of the most common sources of ‘correct analysis, wrong result’ situations in binary options.
| The 3-candle rule: whatever timeframe you use, set your expiry to 3 candles forward. M5 = 15 minutes. M15 = 45 minutes. M30 = 90 minutes. Memorize this and stop guessing. |
How Expiry Time Affects Your Win Rate
Expiry time is not just a mechanical setting — it’s a variable that directly affects whether correct analysis turns into a winning trade. The relationship between expiry length and win rate is straightforward: too short, and noise kills you; too long, and the market has time to fully reverse.
| Expiry Choice | Risk Type | Effect on Trade | Outcome |
| Too short (< 2 candles) | Noise dominates | Random price movement overrides your signal | Correct analysis, wrong result |
| Too long (> 6 candles) | Over-exposure | New news, session changes, or reversals invalidate the setup | Valid trade undermined by time |
| Correct (3–4 candles) | Balanced | Trade has room to develop, limited time for market to fully reverse | Best win rate outcome |
Here’s a concrete example. You spot a bullish pin bar on M15 at a strong support level. The setup is valid — wick-to-body ratio correct, location meaningful, RSI at 28. You set a 5-minute expiry. Price wobbles in both directions for 5 minutes — normal M15 price behavior — and your trade expires as a loss at breakeven. The move you predicted happens at minute 20. You were right. The expiry was wrong.
The same trade with a 45-minute expiry expires well into the upward move you predicted. Win rate improves not because the strategy changed, but because the expiry window matched the timeframe’s natural price behavior. This is the Binany expiry time strategy in its simplest form: align your expiry to your chart, not to your impatience.
Short-term expiry binary options strategy (5–15 minutes) works only on M5 charts where signals are genuinely fast-resolving. Long expiry binary options strategy (60–90 minutes) works best on M30 with high-quality setups at strong levels. Neither works when mismatched with the wrong timeframe.
Matching Timeframe to Your Strategy: Practical Examples
The table below maps every major binary options strategy to its correct analysis timeframe, entry timeframe, expiry, and key entry condition. Use this as your reference card each time you set up a trade on Binany:
| Strategy | Draw Levels On | Entry Chart | Expiry | Key Condition |
| Pin bar at S/R | H1 | M15 | 45–60 min | Pin bar fully closed at level, RSI at extreme |
| Support/Resistance bounce | H1 or M30 | M30 | 60–90 min | Rejection candle at tested zone (2+ bounces) |
| EMA 50 trend pullback | H1 (trend check) | M15 | 45 min | Price pulls back to EMA 50, bullish/bearish candle confirms |
| RSI + Bollinger Bands | — | M15 or M30 | 45–60 min (M15) or 90 min (M30) | RSI extreme + band touch + confirmation candle |
| Post-news pullback | — | M5 or M15 | 15–30 min | Wait 1–3 min after release, enter on first pullback |
Let’s walk through the pin bar setup in detail. You open the H1 chart and identify a key support zone at 1.0850 that has held three times over the past month. You drop to M15 and watch price approach that zone. At the fourth test, a bullish pin bar closes at 1.0848 — long lower wick, small body near the top, RSI reading of 27. Entry: Call trade on M15. Expiry: 45 minutes (3 M15 candles). This is the complete decision framework in action — analysis on H1, entry on M15, expiry matched to timeframe. For more detail on this setup, see our full pin bar strategy guide on Binany.
The EMA 50 pullback example works on the same principle. H1 shows a clear uptrend. On M15, price pulls back to the 50-period EMA and forms a bullish engulfing candle at EMA level. Enter Call, 45-minute expiry. The H1 trend gives the directional bias; the M15 entry candle provides precision; the 45-minute expiry gives the trade room without over-exposure.
Using Multiple Timeframe Analysis on Binany
Multiple timeframe analysis — also called top-down analysis — combines the reliability of higher timeframe levels with the precision of lower timeframe entries. It’s the most effective framework for avoiding the traps of both low-quality M1 signals and overly broad H1 entries.
Here’s the step-by-step process:
- Open H1. Identify the prevailing trend direction: are price making higher highs and higher lows (uptrend), lower highs and lower lows (downtrend), or trading flat in a range? Mark the most significant support and resistance zones visible on this timeframe.
- Drop to M15. Watch for price to approach one of the H1 levels you marked. You’re not entering yet — you’re waiting for the approach and the reaction.
- Wait for an entry signal on M15. A pin bar, engulfing candle, or other price action confirmation at the H1 level is your trigger. The signal must align with the H1 trend direction — bullish signals at support in an uptrend, bearish signals at resistance in a downtrend.
- Enter on M15 with 45-minute expiry. Your directional bias comes from H1; your entry timing and expiry come from M15. This combination maximizes both signal quality and entry precision.
This top-down approach also helps you filter lower timeframe signals that contradict the higher timeframe structure. A bullish M15 pin bar at resistance in an H1 downtrend is a counter-trend signal — the H1 context says to wait, regardless of how the M15 candle looks. Higher timeframe analysis always takes precedence when there’s a conflict.
Round numbers naturally act as support and resistance zones across all timeframes, so they’re worth noting in your H1 analysis. Prices like 1.1000, 1.0800, or $1,950 on gold attract institutional interest and align well with technically-drawn levels. When a technical H1 level coincides with a round number, that zone becomes significantly stronger — and the M15 entry at that zone carries more weight.
Conclusion
Binary options expiry time and timeframe selection are not afterthoughts — they’re foundational decisions that determine whether correct analysis produces winning trades or frustrating losses. The three core rules are simple: avoid M1 entirely; set your expiry to 3–4 candles on whichever timeframe you’re using; and align your chosen timeframe to your strategy.
M15 is your primary trading chart. H1 is your map. The 3-candle expiry rule converts your timeframe into the right expiry window automatically. These three rules together eliminate one of the most consistent sources of unnecessary losses for binary options beginners on Binany.
Test your timeframe and expiry combinations on the Binany demo account before going live. Open M15, mark your levels on H1, and log every trade with the expiry you used. After 30 trades, review your journal and check whether the setups that matched the 3-candle rule outperformed those that didn’t. The data will confirm the framework — and give you the confidence to apply it consistently on a real account. For the technical foundations of candlestick chart reading, Investopedia’s guide to candlestick charts is a useful reference.
FAQ: Timeframe and Expiry Time on Binany
Q: What is the best timeframe for binary options trading?
M15 (15-minute chart) is the recommended starting point for beginners and intermediate traders on Binany. It provides clear, reliable signal quality — enough data per candle to filter most random noise — while generating several quality setups per session. M30 is the next step up for traders who prefer fewer, higher-quality signals. Avoid M1 entirely: price on M1 is dominated by noise and algorithmic activity, which causes valid-looking signals to fail at unacceptably high rates.
Q: How do you choose the right expiry time for binary options?
The core rule is to set your expiry equal to 3–4 candles ahead on whichever chart timeframe you’re using. On M5: 15–25 minutes. On M15: 45–60 minutes. On M30: 60–90 minutes. This window gives the trade enough room for your analysis to develop without over-exposing it to news events, session changes, or full reversals. Expiry that is too short lets noise invalidate a correct trade; expiry that is too long gives the market time to fully reverse your position.
Q: Why is M1 bad for binary options trading?
M1 candles represent only 60 seconds of price movement, which is almost entirely dominated by random short-term fluctuations, algorithmic activity, and spread adjustments rather than meaningful supply and demand dynamics. Patterns that look like valid signals on M1 — pin bars, engulfing candles — fail at a much higher rate than on M15 or M30 because they don’t reflect genuine market structure. Beyond the technical problem, M1 encourages overtrading: the fast pace creates the illusion of productive activity while producing a high volume of low-quality, low-probability trades.
Q: How does expiry time affect binary options results?
Expiry time determines whether your analysis has enough room to play out correctly. Too short an expiry — less than 2 candles on your timeframe — means random noise can close your trade as a loss before the predicted move develops. Too long an expiry introduces unnecessary risk from news events, session changes, or full trend reversals that weren’t part of your original analysis. The 3–4 candle expiry rule minimizes both risks, matching the trade duration to the natural rhythm of your chosen timeframe and maximizing the chance that correct directional analysis produces a winning trade.

Financial writer and market analyst with a passion for simplifying complex trading concepts. He specializes in creating educational content that empowers readers to make informed investment decisions.