Heikin-Ashi vs Candlesticks for Binary Options │ Binany
Every binary options trader on Binany faces the same fundamental question before analyzing a chart: what type of candles am I looking at, and are they giving me the right picture?
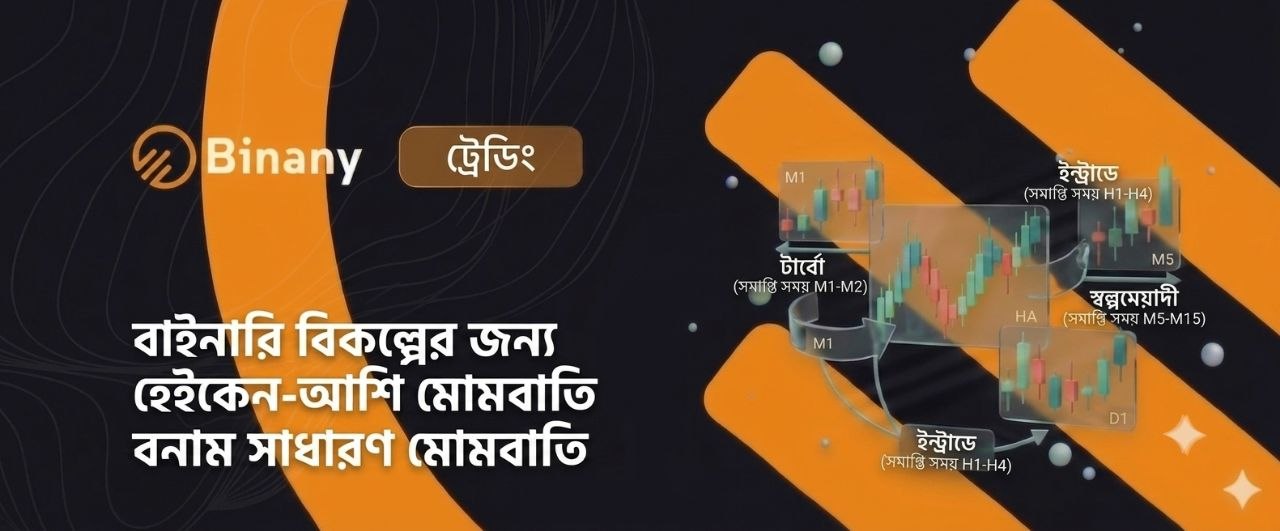
Every binary options trader on Binany faces the same fundamental question before analyzing a chart: what type of candles am I looking at, and are they giving me the right picture? The choice between Heikin-Ashi candles vs standard candlesticks is more consequential than most beginners realize. One shows you the raw, real-time price with all its noise. The other shows you a smoothed, averaged version that makes trends easier to read — but introduces lag and hides the true market close. Neither is universally better. Both have distinct strengths and clear weaknesses for binary options trading. This guide explains exactly what each chart type does, how to read it on Binany, and which to use for which kind of trade.
Risk Disclaimer: Binary options trading involves significant risk of loss. No chart type guarantees profitable entries. Only trade with funds you can afford to lose. This article is for educational purposes only and does not constitute personalized financial or investment advice.
How Standard Candlesticks Work
Standard Japanese candlesticks — the default chart type used by most traders — represent four pieces of raw price data for every time period: the open (the price at the start of the candle), the high (the highest price reached), the low (the lowest price reached), and the close (the final price at the end of the period). These are often abbreviated as OHLC.
The body of the candle is the thick rectangle between the open and close. A green (or white) body means the close was higher than the open — buyers won that period. A red (or black) body means the close was lower than the open — sellers dominated. The wicks (also called shadows) are the thin lines extending above and below the body, showing the full high and low range.
Every standard candle reflects the exact, unaltered price action during that period. Nothing is smoothed or averaged. This means standard candles react immediately to price changes — but they also capture every spike, reversal, and moment of market noise. On shorter timeframes like 1-minute or 5-minute charts, this can make the chart feel chaotic and difficult to read.
What Are Heikin-Ashi Candles?
Heikin-Ashi (Japanese for “average bar”) is a modified candlestick type that uses averaged values rather than raw OHLC data. Each Heikin-Ashi candle is calculated using a combination of the current period’s price data and the values of the previous Heikin-Ashi candle. This averaging process smooths the chart, filtering out much of the short-term price noise and making the overall trend direction easier to see at a glance.
The key difference in how each value is calculated:
- HA Close: (Open + High + Low + Close) ÷ 4 — an average of the four price points for the current period
- HA Open: (Previous HA Open + Previous HA Close) ÷ 2 — an average of the prior candle’s open and close
- HA High: The maximum of the current High, HA Open, and HA Close
- HA Low: The minimum of the current Low, HA Open, and HA Close
The result of this averaging is a chart that looks smoother and more flowing than standard candles. Uptrends appear as consecutive green candles; downtrends appear as consecutive red candles. Short-lived reversals and single-candle spikes are absorbed into the averaging and often disappear from view.
⚠ Critical point: The Heikin-Ashi close is an averaged value — it is NOT the real current market price. If you need to know exactly where the market is trading right now, Heikin-Ashi will mislead you. Always check the actual price in the Binany price display, not the HA candle close.
Heikin-Ashi vs Standard Candlesticks: Key Differences at a Glance
The table below summarizes the most important differences between the two chart types for binary options traders on Binany.
| Feature | Standard Candlesticks | Heikin-Ashi Candles |
| Price data | Raw OHLC — exact real-time open, high, low, close | Averaged OHLC — smoothed from prior and current candle values |
| Noise level | High — every tick and spike is visible | Low — short-term noise is filtered out |
| Trend clarity | Moderate — trend visible but candles can be noisy | High — consecutive same-color candles clearly show trend direction |
| Lag | None — reflects price instantly | Present — averaged values respond more slowly to price changes |
| Reversal detection | Fast — immediate color change on a new candle | Slower — may take 1–2 extra candles to signal a reversal |
| Real close price | Yes — the candle close = the actual market price | No — the HA close is an average, not the real market price |
| Short expiry suitability | High — precise timing on 1–5 min charts | Lower — lag makes very short expiries risky |
| Trend-following use | Moderate — requires additional trend filters | High — color streaks and wick patterns clearly show trend strength |
| Price action patterns | Excellent — pin bars, engulfing, doji all work as designed | Limited — patterns are smoothed and may not be geometrically clean |
| Best for | Precise entries, short expiries, price-action strategies | Trend identification, directional bias, longer expiries |
Strengths and Weaknesses of Each Chart Type
| Standard Candlesticks — Pros | Standard Candlesticks — Cons |
| ✓ Real close price for precise entries | ✗ Noisy on lower timeframes — many false signals |
| ✓ Price action patterns (pin bar, engulfing) work cleanly | ✗ Harder to spot sustained trend direction at a glance |
| ✓ No lag — instant response to price movement | ✗ Emotional candles can be misleading |
| ✓ Best for short expiries (1–5 min) | ✗ Requires more discipline to filter noise |
| Heikin-Ashi Candles — Pros | Heikin-Ashi Candles — Cons |
| ✓ Smooth, clear trend direction — easy to read visually | ✗ Lagging — signals appear 1–2 candles after the real move |
| ✓ Filters out short-term noise and spike candles | ✗ Close price is NOT the real market price |
| ✓ Color streaks clearly show trend continuation | ✗ Not suitable for very short expiries |
| ✓ Easier to hold bias and avoid emotional whipsaws | ✗ Classic price action patterns may not form cleanly |
The takeaway from the pros and cons: standard candlesticks reward precision; Heikin-Ashi rewards patience. If your strategy relies on reading individual candle patterns — pin bars, engulfing candles, doji formations — standard candles are the correct tool. These patterns are defined by the relationship between the open, high, low, and close of individual candles, and Heikin-Ashi’s averaging distorts those relationships. The pin bar strategy guide on Binany is built for standard candlesticks, for example.
Heikin-Ashi rewards traders who want to stay with a trend until it definitively ends. If you want to ride a clear directional move without being shaken out by every small counter-move, Heikin-Ashi makes that much easier — because those small counter-moves are smoothed away.
Switching Chart Types on Binany
Binany’s chart interface allows you to switch between standard candlesticks and Heikin-Ashi quickly and easily without leaving your trading screen. Here is how to do it:
- Open your Binany chart on any asset.
- Look for the chart type selector — typically a candlestick icon or a dropdown near the top of the chart area.
- Select ‘Heikin-Ashi’ from the available chart type options. The chart will redraw immediately using averaged candle values.
- To switch back to standard candles, select ‘Candlestick’ (or ‘Japanese Candlestick’) from the same menu.
The simplest way to understand the difference is to see it on the same asset at the same time. Open the Binany demo account, pick a trending asset, and switch between the two chart types several times. Notice how Heikin-Ashi smooths the move and how standard candles show every individual price reaction. That visual comparison will teach you more than any description.
How to Trade Each Chart Type on Binany
Trading with Heikin-Ashi Candles
Heikin-Ashi provides two primary signals for binary options entries:
- Trend continuation (color streak): When you see three or more consecutive green Heikin-Ashi candles with no (or very small) lower wicks, the uptrend is strong and momentum is sustained. This is a CALL (Up) bias — look to enter on any brief pause. Conversely, three or more consecutive red candles with no (or very small) upper wicks signal a strong downtrend — PUT (Down) bias.
- Color change reversal: When the Heikin-Ashi candle color switches from green to red (or red to green), it may signal a trend reversal. However, because of the averaging lag, this signal is slower than a standard candle reversal. Wait for at least two candles of the new color before treating the color change as confirmed.
Heikin-Ashi CALL signal: Multiple consecutive green candles, small or absent lower wicks, upward slope. Enter CALL at the open of a continuation candle. Use longer expiries (10–30 min) to allow the smoothed signal to play out.
Heikin-Ashi PUT signal: Multiple consecutive red candles, small or absent upper wicks, downward slope. Enter PUT at the open of a continuation candle. Use longer expiries (10–30 min).
Trading with Standard Candlesticks
Standard candles on Binany are best suited for precise pattern-based entries at key levels. The most reliable signals are those used in price action strategies: pin bars at support or resistance, bullish or bearish engulfing patterns at a key level, and doji formations at trend extremes. The support and resistance strategy on Binany shows how to combine these candle patterns with structural levels for the highest-quality entries.
Because standard candles carry no lag, they are the correct choice for shorter expiry times. If you are placing a 1-minute or 2-minute trade based on a 1-minute chart, standard candles give you real-time information; Heikin-Ashi’s lag would mean your signal arrived one or two candles too late.
Which Chart Type Should You Use — and When?
The answer is not either-or. Many experienced traders use both chart types in combination: Heikin-Ashi to identify the trend and directional bias, standard candles to time the exact entry.
Here is a practical framework:
- For trend identification and directional bias: Use Heikin-Ashi. The color streaks and wick patterns give you a clear, unambiguous read of the dominant direction. If Heikin-Ashi is showing six consecutive green candles with small wicks, you know the uptrend is strong.
- For precise entry timing: Switch to standard candles. Once you have your directional bias from Heikin-Ashi, look at the standard candle chart to find the specific candle pattern — pin bar, engulfing — that gives you the entry signal at the right level.
- For longer expiries (15–60 min) in a strong trend: Heikin-Ashi alone can work well. The smoothed trend signal matches the longer timeframe, and the lag becomes less important when the expiry is 30 minutes away.
- For short expiries (1–5 min): Standard candles are the better choice. The lag in Heikin-Ashi makes it unsuitable for entries where every candle counts. The best timeframe and expiry time guide on Binany covers how to match chart type, timeframe, and expiry together.
Risk and Money Management
The chart type you use does not change the fundamental risk profile of binary options trading. Every trade carries the risk of loss regardless of whether you read it on Heikin-Ashi or standard candles. A smoother-looking chart can actually create a false sense of certainty — Heikin-Ashi’s clean trends can make a trade look more predictable than it is.
Apply the same money management rules regardless of which chart type you trade from: a fixed stake as a percentage of your balance, a daily loss limit set before the session starts, and no deviation from your plan based on how confident the chart looks.
The money management guide on Binany covers these frameworks in full. Apply them consistently whether you are trading on Heikin-Ashi or standard candles.
Common Mistakes to Avoid
- Reading the Heikin-Ashi close as the real price: The HA close is an averaged value. If you use it to judge where the market actually is, you will be wrong. Always check the actual price display on Binany, not the HA candle close.
- Expecting instant reversals on Heikin-Ashi: Because of the averaging, a trend reversal on a Heikin-Ashi chart takes one or two candles longer to appear than the same reversal on standard candles. If you enter a reversal trade the moment you see the first opposite-color HA candle, you may be one candle too early.
- Ignoring the lag when using short expiries: A 1-minute Heikin-Ashi signal in a fast-moving market is one or two candles behind the real market. On a 1-minute expiry, one or two candles is the entire trade. This mismatch will cost you entries.
- Switching chart types mid-trade: Once you have entered a trade based on a Heikin-Ashi signal, do not switch to standard candles mid-trade to monitor it. The two charts show different pictures of the same price, and switching back and forth will lead to confused, emotional decision-making.
- Using Heikin-Ashi for price-action patterns: Pin bars and engulfing candles on Heikin-Ashi charts are geometrically distorted by the averaging. If you are trading these patterns, do it on standard candles where the true open and close define the pattern.
- Not practising on demo before going live: The visual difference between the two chart types requires time to internalize. Switching from standard candles to Heikin-Ashi without practice can be disorienting. Use the Binany demo account to get comfortable with each before trading real funds.
Conclusion: Two Tools, Not Two Rivals
The question of Heikin-Ashi candles vs standard candlesticks does not have a single right answer — it has a right answer for each trading situation. Standard candlesticks give you precision, real prices, and the full pattern library of price action. Heikin-Ashi gives you clarity, smoothed trends, and a cleaner read of directional momentum. Both are available on Binany, and the most effective approach often uses both in sequence.
The most important thing to take from this guide is the critical difference: Heikin-Ashi’s close is an averaged value, not the real market price. Keep that in mind every time you switch to the smoothed chart, and adjust your entry timing to account for the lag that averaging introduces.
The best way to build intuition for both chart types is to trade them side by side on the Binany demo account. Open the same asset on two timeframes, use standard candles on one and Heikin-Ashi on the other, and watch how they each respond to the same price moves. Once you understand how each chart type thinks, you will know exactly which one to reach for — and when.

Financial writer and market analyst with a passion for simplifying complex trading concepts. He specializes in creating educational content that empowers readers to make informed investment decisions.